On Saturday, the Washington Nationals baseball team played their first spring training game of the season. I was listening to the radio call in the background as I went about my day. I also, however, kept an eye on a community blog called Talk Nats.
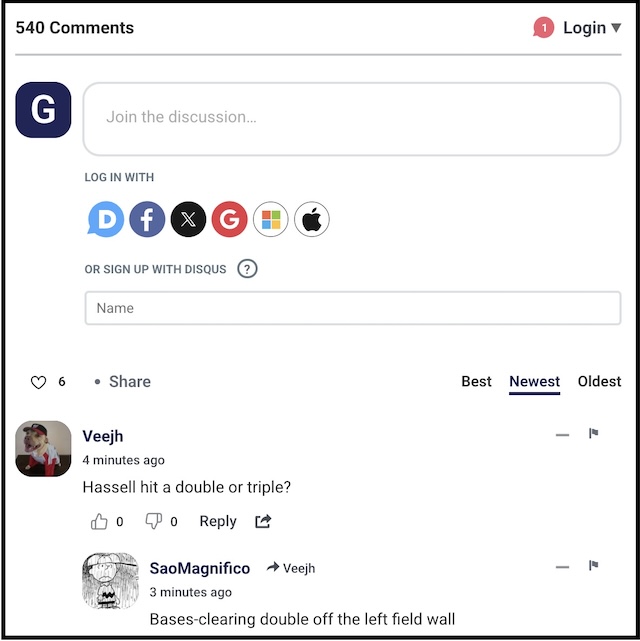
The site moderators had posted an article about today’s game. As play unfolded, a group of Nationals fans gathered in the comment threads to discuss the unfolding action.
Much of the discussion focused on specific plays.
“Nasty from Ferrer,” noted a commenter, soon after one of the team’s best relief pitchers, Jose Ferrer, struck out two batters.
“Looks like we took the Ferreri [sic] out of the garage,” someone else replied.
There were also jokes, such as when, early in the game, someone deadpanned: “Anyone who K’s [strikes out] is cut.” As well as more general discussion of the season ahead.
If you followed the thread long enough, it became clear that many of the commenters know each other, while others were meeting for the first time. As the game wrapped up, someone mentions that they’re listening from a part of Canada that recently received three feet of snow. Another commentator replied by recalling a trip they took to that same area: “It was amazing.”
Ultimately, over 540 comments were left over the duration of an otherwise uneventful, early season exhibition match.